Mathematics Lessons
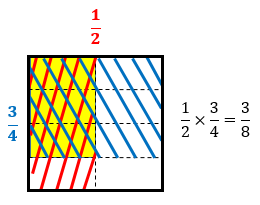
Multiplying Fractions (Co-Taught)
In this lesson, the content educator and special educator work with different groups working with multiplication of fractions. During the first phase of the lesson, the special educator works with a group of struggling students to practice foundational skills while the content educator teaches the new content lesson on multiplying fractions. During the next phase, students who did very well on the new content lesson work with the special educator on an enrichment task while the struggling students and students who might need a replay of the new content lesson are taught by the content teacher. During the next phase of the lesson, all students come together to work in partners to solve more multiplication problems with fractions. The lesson concludes with an exit ticket.
In this lesson, the content educator and special educator work with different groups working with multiplication of fractions. During the first phase of the lesson, the special educator works with a group of struggling students to practice foundational skills while the content educator teaches the new content lesson on multiplying fractions. During the next phase, students who did very well on the new content lesson work with the special educator on an enrichment task while the struggling students and students who might need a replay of the new content lesson are taught by the content teacher. During the next phase of the lesson, all students come together to work in partners to solve more multiplication problems with fractions. The lesson concludes with an exit ticket.
| Multiplying Fractions (Co-Taught) |
Scatterplots
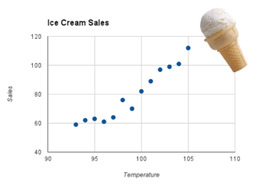
I created station activities for a ninth grade class learning about scatterplots. There were three stations, each of which produced a different scatterplot. One station requested that students plot their height with the length of their legs (this produced a positive correlation). Another station requested that students plot their height with the number of letters in their name (to produce a scatterplot with no correlation). The final station requested students to remove a number of chips from a bag and plot the number in the bag against the number out of the bag (which produced a negative correlation). Each class, therefore, produced slightly different results, but each class could see an example of each type of correlation of scatterplots. Students were also involved in the creation of the scatterplots, which keeps them engaged in the results.
I created station activities for a ninth grade class learning about scatterplots. There were three stations, each of which produced a different scatterplot. One station requested that students plot their height with the length of their legs (this produced a positive correlation). Another station requested that students plot their height with the number of letters in their name (to produce a scatterplot with no correlation). The final station requested students to remove a number of chips from a bag and plot the number in the bag against the number out of the bag (which produced a negative correlation). Each class, therefore, produced slightly different results, but each class could see an example of each type of correlation of scatterplots. Students were also involved in the creation of the scatterplots, which keeps them engaged in the results.
| Constructing Scatterplots |
Probability with Board Games
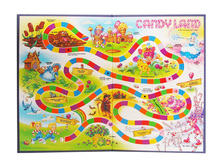
Probability is most often taught with dice and cards, but I created another way to teach theoretical and experimental probability to students in middle school: board games! Using board games such as Trouble, The Game of Life, and Candyland, students can discover the differences between theoretical and experimental probabilities without even realizing they are doing math. For each of these games, or any other, students can count the number of squares that are particular colors and figure out the theoretical probability of landing on those squares, and then they can actually play the game to find the experimental probability that occurs throughout game play as they land on certain colors.
Probability is most often taught with dice and cards, but I created another way to teach theoretical and experimental probability to students in middle school: board games! Using board games such as Trouble, The Game of Life, and Candyland, students can discover the differences between theoretical and experimental probabilities without even realizing they are doing math. For each of these games, or any other, students can count the number of squares that are particular colors and figure out the theoretical probability of landing on those squares, and then they can actually play the game to find the experimental probability that occurs throughout game play as they land on certain colors.
| Using Board Games to Teach Probability |
|
Fraction Name Grids
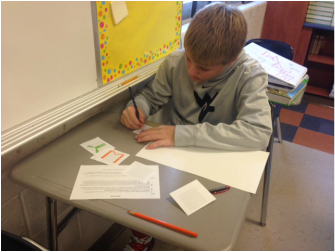
Students study fractions at many grade levels. This activity can be modified and used with any grade and ability level. Students use small grids of boxes to color in the letters of their names, in any way they choose. Each of the grids has a different number of boxes inside, so the fraction that is colored in must be calculated and reduced. Then, students can convert this fraction to a decimal and/or a percent. The letters can be glued to paper with the corresponding fractions written underneath. The resulting Name Grids can be used throughout a unit on fractions. Students can order the fractions, and they can add, subtract, multiply, and divide each of them. This activity is great for visual and kinesthetic learners and gives students purpose and ownership in their mathematical practices. |
|
Miles, Gas, Money...
When teaching a unit on rational numbers, including adding, subtracting, multiplying, and dividing fractions and decimals, I created a guided activity where students used all of these skills in a real-world application. First, I let each student choose between three popular destinations near their hometown (an amusement park, a zoo, and a sports game). Students used MapQuest to find the distance to their destination with an included stop. They then used a fuel economy site to choose a vehicle and find its gas mileage. Using division, they determined how many gallons of gas they would need to travel to their destination, and then calculated the total gas costs. In this particular assignment, the students then divided this total cost between several friends, but it could be modified in several ways. This activity showed students how math comes into play in the real world, while letting them discover these truths for themselves using personal choices they had made.
When teaching a unit on rational numbers, including adding, subtracting, multiplying, and dividing fractions and decimals, I created a guided activity where students used all of these skills in a real-world application. First, I let each student choose between three popular destinations near their hometown (an amusement park, a zoo, and a sports game). Students used MapQuest to find the distance to their destination with an included stop. They then used a fuel economy site to choose a vehicle and find its gas mileage. Using division, they determined how many gallons of gas they would need to travel to their destination, and then calculated the total gas costs. In this particular assignment, the students then divided this total cost between several friends, but it could be modified in several ways. This activity showed students how math comes into play in the real world, while letting them discover these truths for themselves using personal choices they had made.
| Miles, Gas, Money |
