Mathematics Discovery Activities
Properties of Quadrilaterals
With these activities, students measure various quadrilaterals to highlight the patterns within them. These patterns will bring to light the properties of the quadrilaterals, such as their angle measures, side lengths, and diagonals. These activities help students construct knowledge while practicing skills in measurement.
With these activities, students measure various quadrilaterals to highlight the patterns within them. These patterns will bring to light the properties of the quadrilaterals, such as their angle measures, side lengths, and diagonals. These activities help students construct knowledge while practicing skills in measurement.

Properties of Parallelograms
This activity includes a two-page student worksheet and one page of different sized, numbered parallelograms. It is recommended that the parallelograms be printed on cardstock or other heavy paper and then cut out before class. Students only need one parallelogram at a time, so one set of parallelograms should work for a whole class. Student instructions are listed on the student worksheet.
Properties of Kites and Trapezoids
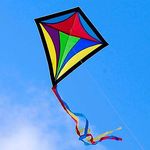
This activity includes a four-page student worksheet which includes real-world pictures of kites and trapezoids.
|

Properties of Rectangles, Squares, and Rhombuses
This activity includes a two-page student worksheet that requires students to take measurements of everyday objects that are quadrilaterals. Students may bring these items in on their own, and/or the teacher may bring in more items. Student instructions are listed on the student worksheet.
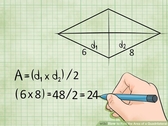
Area of Quadrilaterals
For this activity, students work on six teams. Each team has a sheet with several of one type of quadrilateral graphed on graph paper. Each team is responsible for calculating the area of the quadrilaterals on their sheet. Then, they use the measurements and estimated area to derive a formula for the area of their quadrilateral to share with the rest of the class.
| ||||||||||
Polynomials Discovery Activities
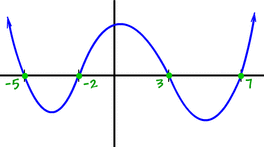
These activities are designed to help high school students discover ideas about polynomials. The Zeroes Discovery Activity contains a two-page student worksheet that asks students to factor polynomials and then enter the factored form into a graphing program such as desmos.com to find the x-intercepts. Students should see a connection between the factors of a polynomial and its x-intercepts. The Remainder Theorem Discovery Activity contains a one-page student worksheet that asks students to first determine if certain binomials are factors of the polynomial by long division or synthetic division, and then record its remainder. Then, students input values for x that match with the binomials to find the value of f(x). This will help students see the connections between the remainders and the values of f(x).
These activities are designed to help high school students discover ideas about polynomials. The Zeroes Discovery Activity contains a two-page student worksheet that asks students to factor polynomials and then enter the factored form into a graphing program such as desmos.com to find the x-intercepts. Students should see a connection between the factors of a polynomial and its x-intercepts. The Remainder Theorem Discovery Activity contains a one-page student worksheet that asks students to first determine if certain binomials are factors of the polynomial by long division or synthetic division, and then record its remainder. Then, students input values for x that match with the binomials to find the value of f(x). This will help students see the connections between the remainders and the values of f(x).
|
| ||||
Correlation Discovery Activities
These activities can all be found within the Uncovering Correlation unit found here. A few have been highlighted here in order to give a better description.
These activities can all be found within the Uncovering Correlation unit found here. A few have been highlighted here in order to give a better description.
|
Discovering the Correlation Coefficient
In this lab, students use a computer simulation and create several scatterplots that have different correlation coefficients. By observing each scatterplot and its correlation coefficient, students can discover the characteristics of the correlation coefficient, namely that it is always between -1 and +1, and that a value close to -1 or +1 means that the data is strongly correlated. (I found part of this lab online, but have unfortunately lost where it came from so I cannot give appropriate credit by name.)
|
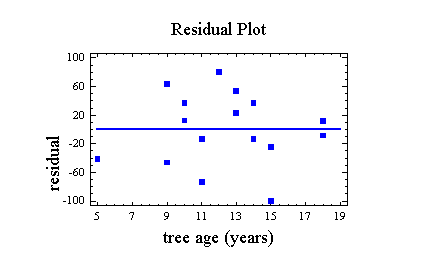
Residuals Exploration
In this lab, students learn how to calculate residuals and calculate and plot them for three different lines of "best fit." Using their knowledge of lines of best fit, they deduce what properties of residuals should be present for the most accurate line of best fit.
|
Using Nonlinear Regression
This lab lets students use the online graphing calculator Desmos to determine when and why it is better to use nonlinear regression lines for some data sets. Students construct a scatterplot and fit different lines and curves to the data to see how each one affects the correlation coefficient, coefficient of determination, and residuals. This lab shows the importance of choosing the best model for a situation.
| ||||||
